Clocks on the cusp of a nuclear age

You need three things to build a clock: an energy source, a resonator, and a counter. In an analog wrist watch, for example, a small battery is the energy source that sends a small electric signal to a quartz crystal, which, in response, oscillates at a specific frequency (piezoelectric effect). If the amount of energy in each signal is enough to cause the crystal to oscillate at its resonant frequency, the crystal becomes the resonator. The counter tracks the crystal’s oscillation and converts it to seconds using predetermined rules.

Notice how the clock’s proper function depends on the relationship between the battery and the quartz crystal and the crystal’s response. The signals from the battery have to have the right amount of energy to excite the crystal to its resonant frequency and the crystal’s oscillation in response has to happen at a fixed frequency as long as it receives those signals. To make better clocks, physicists have been able to fine-tune these two parameters to an extreme degree.

Today, as a result, we have clocks that don’t lose more than one second of time every 30 billion years. These are the optical atomic clocks: the energy source is a laser, the resonator is an atom, and the counter is a particle detector.

An atomic clock’s identity depends on its resonator. For example, many of the world’s countries use caesium atomic clocks to define their respective national “frequency standards”. (One such clock at the National Physical Laboratory in New Delhi maintains Indian Standard Time.) A laser imparts a precise amount of energy to excite a caesium-133 atom to a particular higher energy state. The atom soon after drops from this state to its lower ground state by emitting light of frequency exactly 9,192,631,770 Hz. When a particle detector receives this light and counts out 9,192,631,770 waves, it will report one second has passed.

Caesium atomic clocks are highly stable, losing no more than a second in 20 million years. In fact, scientists used to define a second in terms of the time Earth took to orbit the Sun once; they switched to the caesium atomic clock because “it was more stable than Earth’s orbit” (source).

But there is also room for improvement. The higher the frequency of the emitted radiation, the more stable an atomic clock will be. The emission of a caesium atomic clock has a frequency of 9.19 GHz whereas that in a strontium clock is 429.22 THz and in a ytterbium-ion clock is 642.12 THz — in both cases five orders of magnitude higher. (9.19 GHz is in the microwave frequency range whereas the other two are in the optical range, thus the name “optical” atomic clock.)

Optical atomic clocks also have a narrower linewidth, which is the range of frequencies that can prompt the atom to jump to the higher energy level: the narrower the linewidth, the more precisely the jump can be orchestrated. So physicists today are trying to build and perfect the next generation of atomic clocks with these resonators. Some researchers have said they could replace the caesium frequency standard later this decade.

But yet other physicists have also already developed an idea to build the subsequent generation of clocks, which are expected to be at least 10-times more accurate than optical atomic clocks. Enter: the nuclear clock.

When an atom, like that of caesium, jumps between two energy states, the particles gaining and losing the energy are the atom’s electrons. These electrons are arranged in energy shells surrounding the nucleus and interact with the external environment. For a September 2020 article in The Wire Science, IISER Pune associate professor and a member of a team building India’s first strontium atomic clock Umakant Rapol said the resonator needs to be “immune to stray magnetic fields, electric fields, the temperature of the background, etc.” Optical atomic clocks achieve this by, say, isolating the resonator atoms within oscillating electric fields. A nuclear clock offers to get rid of this problem by using an atom’s nucleus as the resonator instead.

Unlike electrons, the nucleus of an atom is safely ensconced further in, where it is also quite small, making up only around 0.01% of the atom’s volume. The trick here is to find an atomic nucleus that’s stable and whose resonant frequency is accessible with a laser.

In 1976, physicists studying the decay of uranium-233 nuclei reported some properties of the thorium-229 nucleus, including estimating that the lowest higher-energy level to which it could jump required less than 100 eV of energy. Another study in 1990 estimated the requirement to be under 10 eV. In 1994, two physicists estimated it to be around 3.5 eV. The higher energy state of a nucleus is called its isomer and is denoted with the suffix ‘m’. For example, the isomer of the thorium-229 nucleus is denoted thorium-229m.

After a 2005 study further refined the energy requirement to 5.5 eV, a 2007 study provided a major breakthrough. With help from state-of-the-art instruments at NASA, researchers in the US worked out the thorium-229 to thorium-229m jump required 7.6 eV. This was significant. Energy is related to frequency by the Planck equation: E = hf, where h is Planck’s constant. To deliver 3.5 eV of energy, then, a laser would have to operate in the optical or near-ultraviolet range. But if the demand was 7.6 eV, the laser would have to operate in the vacuum ultraviolet range.

Further refinement by more researchers followed but they were limited by one issue: since they still didn’t have a sufficiently precise value of the isomeric energy, they couldn’t use lasers to excite the thorium-229 nucleus and find out. Instead, they examined thorium-229m nuclei formed by the decay of other elements. So when on April 29 this year a team of researchers from Germany and Austria finally reported using a laser to excite thorium-229 nuclei to the thorium-229m state, their findings sent frissons of excitement through the community of clock-makers.

The researchers’ setup had two parts. In the first, they drew inspiration from an idea a different group had proposed in 2010: to study thorium-229 by placing these atoms inside a larger crystal. The European group grew two calcium fluoride (CaF2) crystals in the lab doped heavily with thorium-229 atoms, with different doping concentrations. In a study published a year earlier, different researchers had reported observing for the first time thorium-229m decaying back to its ground state while within calcium fluoride and magnesium fluoride (MgF2) crystals. Ahead of the test, the European team cooled the crystals to under -93º C in a vacuum.

In the second part, the researchers built a laser with output in the vacuum ultraviolet range, corresponding to a wavelength of around 148 nm, for which off-the-shelf options don’t exist at the moment. They achieved the output instead by remixing the outputs of multiple lasers.

The researchers conducted 20 experiments: in each one, they increased the laser’s wavelength from 148.2 nm to 150.3 nm in 50 equally spaced steps. They also maintained a control crystal doped with thorium-232 atoms. Based on these attempts, they reported their laser elicited a distinct emission from the two test crystals when the laser’s wavelength was 148.3821 nm. The same wavelength when aimed at the CaF2 crystal doped with thorium-232 didn’t elicit an emission. This in turn implied an isomeric transition energy requirement of 8.35574 eV. The researchers also worked out based on these details that a thorium-229m nucleus would have a half-life of around 29 minutes in vacuum — meaning it is quite stable.

Physicists finally had their long-sought prize: the information required to build a nuclear clock by taking advantage of the thorium-229m isomer. In this setup, then, the energy source could be a laser of wavelength 148.3821 nm; the resonator could be thorium-229 atoms; and the counter could look out for emissions of frequency 2,020 THz (plugging 8.355 eV into the Planck equation).

Other researchers have already started building on this work as part of the necessary refinement process and have generated useful insights as well. For example, on July 2, University of California, Los Angeles, researchers reported the results of a similar experiment using lithium strontium hexafluoroaluminate (LiSrAlF6) crystals, including a more precise estimate of the isomeric energy gap: 8.355733 eV.

About a week earlier, on June 26, a team from Austria, Germany, and the US reported using a frequency comb to link the frequency of emissions from thorium-229 nuclei to that from a strontium resonator in an optical atomic clock at the University of Colorado. A frequency comb is a laser whose output is in multiple, evenly spaced frequencies. It works like a gear that translates the higher frequency output of a laser to a lower frequency, just like the lasers in a nuclear and an optical atomic clock. Linking the clocks up in this way allows physicists to understand properties of the thorium clock in terms of the better-understood properties of the strontium clock.

Atomic clocks moving into the era of nuclear resonators isn’t just one more step up on the Himalayan mountain of precision timekeeping. Because nuclear clocks depend on how well we’re able to exploit the properties of atomic nuclei, they also create a powerful incentive and valuable opportunities to probe nuclear properties.

In a 2006 paper, a physicist named VV Flambaum suggested that if the values of the fine structure constant and/or the strong interaction parameter change even a little, their effects on the thorium-229 isomeric transition would be very pronounced. The fine structure constant is a fundamental constant that specifies the strength of the electromagnetic force between charged particles. The strong interaction parameter specifies this vis-à-vis the strong nuclear force, the strongest force in nature and the thing that holds protons and neutrons together in a nucleus.

Probing the ‘stability’ of these numbers in this way opens the door to new kinds of experiments to answer open questions in particle physics — helped along by physicists’ pursuit of a new nuclear frequency standard.

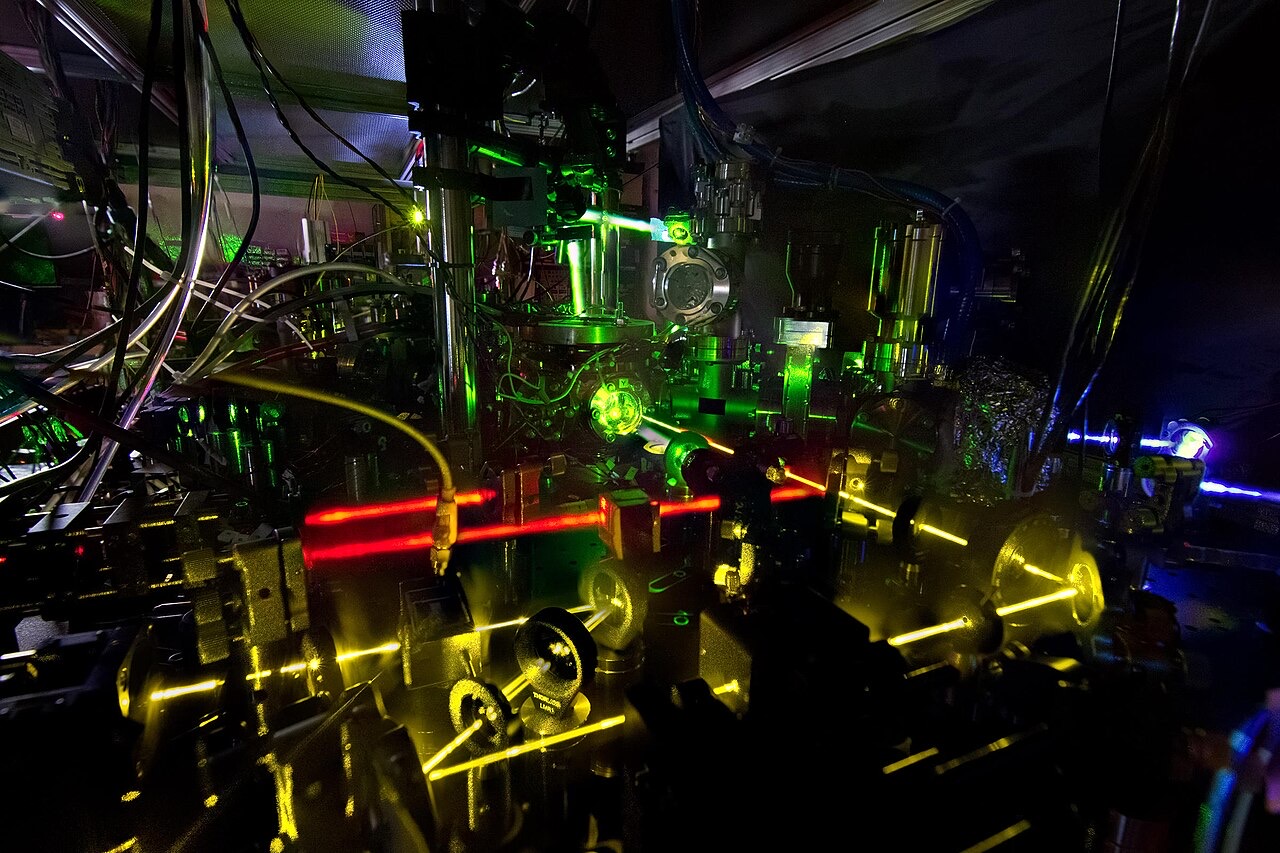
Featured image: A view of an ytterbium atomic clock at the US NIST, October 16, 2014. Credit: N. Phillips/NIST.

Scientists make video of molecule rotating

A research group in Germany has captured images of what a rotating molecule looks like. This is a significant feat because it is very difficult to observe individual atoms and molecules, which are very small as well as very fragile. Scientists often have to employ ingenious techniques that can probe their small scale but without destroying them in the act of doing so.

The researchers studied carbonyl sulphide (OCS) molecules, which has a cylindrical shape. To perform their feat, they went through three steps. First, the researchers precisely calibrated two laser pulses and fired them repeatedly – ~26.3 billion times per second – at the molecules to set them spinning.

Next, they shot a third laser at the molecules. The purpose of this laser was to excite the valence electrons forming the chemical bonds between the O, C and S atoms. These electrons absorb energy from the laser’s photons, become excited and quit the bonds. This leaves the positively charged atoms close to each other. Since like charges repel, the atoms vigorously push themselves apart and break the molecule up. This process is called a Coulomb explosion.

At the moment of disintegration, an instrument called a velocity map imaging (VMI) spectrometer records the orientation and direction of motion of the oxygen atom’s positive charge in space. Scientists can work backwards from this reading to determine how the molecule might have been oriented just before it broke up.

In the third step, the researchers restart the experiment with another set of OCS molecules.

By going through these steps repeatedly, they were able to capture 651 photos of the OCS molecule in different stages of its rotation.

These images cannot be interpreted in a straightforward way – the way we interpret images of, say, a rotating ball.

This is because a ball, even though it is composed of millions of molecules, has enough mass for the force of gravity to dominate proceedings. So scientists can understand why a ball rotates the way it does using just the laws of classical mechanics.

But at the level of individual atoms and molecules, gravity becomes negligibly weak whereas the other three fundamental forces – including the electromagnetic force – become more prominent. To understand the interactions between these forces and the particles, scientists use the rules of quantum mechanics.

This is why the images of the rotating molecules look like this:

Steps of the molecule’s rotation. Credit: DESY, Evangelos Karamatskos

These are images of the OCS molecule as deduced by the VMI spectrometer. Based on them, the researchers were also able to determine how long the molecule took to make one full rotation.

As a spinning ball drifts around on the floor, we can tell exactly where it is and how fast it is spinning. However, when studying particles, quantum mechanics prohibits observers from knowing these two things with the same precision at the same time. You probably know this better as Heisenberg’s uncertainty principle.

So if you have a fix on where the molecule is, that measurement prohibits you from knowing exactly how fast it is spinning. Confronted with this dilemma, scientists used the data obtained by the VMI spectrometer together with the rules of quantum mechanics to calculate the probability that the molecule’s O, C and S atoms were arranged a certain way at a given point of time.

The images above visualise these probabilities as a colour-coded map. With the position of the central atom (presumably C) fixed, the probability of finding the other two atoms at a certain position is represented on a blue-red scale. The redder a pixel is, the higher the probability of finding an atom there.

Rotational clock depicting the molecular movie of the observed quantum dynamics of OCS. Credit: doi.org/10.1038/s41467-019-11122-y

For example, consider the images at 12 o’clock and 6 o’clock: the OCS molecule is clearly oriented horizontally and vertically, resp. Compare this to the measurement corresponding to the image at 9 o’clock: the molecule appears to exist in two configurations at the same time. This is because, approximately speaking, there is a 50% probability that it is oriented from bottom-left to top-right and a 50% probability that it is oriented from bottom-right to top-left. The 10 o’clock figure represents the probabilities split four different ways. The ones at 4 o’clock and 8 o’clock are even more messy.

But despite the messiness, the researchers found that the image corresponding to 12 o’clock repeated itself once every 82 picoseconds. Ergo, the molecule completed one rotation every 82 picoseconds.

This is equal to 731.7 billion rpm. If your car’s engine operated this fast, the resulting centrifugal force, together with the force of gravity, would tear its mechanical joints apart and destroy the machine. The OCS molecule doesn’t come apart this way because gravity is 100 million trillion trillion times weaker than the weakest of the three subatomic forces.

The researchers’ study was published in the journal Nature Communications on July 29, 2019.

Chromodynamics: Gluons are just gonzo

One of the more fascinating bits of high-energy physics is the branch of physics called quantum chromodynamics (QCD). Don’t let the big name throw you off: it deals with a bunch of elementary particles that have a property called colour charge. And one of these particles creates a mess of this branch of physics because of its colour charge – so much so that it participates in the story that it is trying to shape. What could be more gonzo than this? Hunter S. Thompson would have been proud.

Like electrons have electric charge, particles studied by QCD have a colour charge. It doesn’t correspond to a colour of any kind; it’s just a funky name.

(Richard Feynman wrote about this naming convention in his book, QED: The Strange Theory of Light and Matter (pp. 163, 1985): “The idiot physicists, unable to come up with any wonderful Greek words anymore, call this type of polarization by the unfortunate name of ‘color,’ which has nothing to do with color in the normal sense.”)

The fascinating thing about these QCD particles is that they exhibit a property called colour confinement. It means that all particles with colour charge can’t ever be isolated. They’re always to be found only in pairs or bigger clumps. They can be isolated in theory if the clumps are heated to the Hagedorn temperature: 1,000 billion billion billion K. But the bigness of this number has ensured that this temperature has remained theoretical. They can also be isolated in a quark-gluon plasma, a superhot, superdense state of matter that has been creating fleetingly in particle physics experiments like the Large Hadron Collider. The particles in this plasma quickly collapse to form bigger particles, restoring colour confinement.

There are two kinds of particles that are colour-confined: quarks and gluons. Quarks come together to form bigger particles called mesons and baryons. The aptly named gluons are the particles that ‘glue’ the quarks together.

The force that acts between quarks and gluons is called the strong nuclear force. But this is misleading. The gluons actually mediate the strong nuclear force. A physicist would say that when two quarks exchange gluons, the quarks are being acted on by the strong nuclear force.

Because protons and neutrons are also made up of quarks and gluons, the strong nuclear force holds the nucleus together in all the atoms in the universe. Breaking this force releases enormous amounts of energy – like in the nuclear fission that powers atomic bombs and the nuclear fusion that powers the Sun. In fact, 99% of a proton’s mass comes from the energy of the strong nuclear force. The quarks contribute the remaining 1%; gluons are massless.

When you pull two quarks apart, you’d think the force between them will reduce. It doesn’t; it actually increases. This is very counterintuitive. For example, the gravitational force exerted by Earth drops off the farther you get away from it. The electromagnetic force between an electron and a proton decreases the more they move apart. But it’s only with the strong nuclear force that the force between two particles on which the force is acting actually increases as they move apart. Frank Wilczek called this a “self-reinforcing, runaway process”. This behaviour of the force is what makes colour confinement possible.

However, in 1973, Wilczek, David Gross and David Politzer found that the strong nuclear force increases in strength only up to a certain distance – around 1 fermi (0.000000000000001 metres, slightly larger than the diameter of a proton). If the quarks are separated by more than a fermi, the force between them falls off drastically, but not completely. This is called asymptotic freedom: the freedom from the force beyond some distance drops off asymptotically towards zero. Gross, Politzer and Wilczek won the Nobel Prize for physics in 2004 for their work.

In the parlance of particle physics, what makes asymptotic freedom possible is the fact that gluons emit other gluons. How else would you explain the strong nuclear force becoming stronger as the quarks move apart – if not for the gluons that the quarks are exchanging becoming more numerous as the distance increases?

This is the crazy phenomenon that you’re fighting against when you’re trying to set off a nuclear bomb. This is also the crazy phenomenon that will one day lead to the Sun’s death.

The first question anyone would ask now is – doesn’t asymptotic freedom violate the law of conservation of energy?

The answer lies in the nothingness all around us.

The vacuum of deep space in the universe is not really a vacuum. It’s got some energy of itself, which astrophysicists call ‘dark energy’. This energy manifests itself in the form of virtual particles: particles that pop in and out of existence, living for far shorter than a second before dissipating into energy. When a charged particle pops into being, its charge attracts other particles of opposite charge towards itself and repels particles of the same charge away. This is high-school physics.

But when a charged gluon pops into being, something strange happens. An electron has one kind of charge, the positive/negative electric charge. But a gluon contains a ‘colour’ charge and an ‘anti-colour’ charge, each of which can take one of three values. So the virtual gluon will attract other virtual gluons depending on their colour charges and intensify the colour charge field around it, and also change its colour according to whichever particles are present. If this had been an electron, its electric charge and the opposite charge of the particle it attracted would cancel the field out.

This multiplication is what leads to the build up of energy when we’re talking about asymptotic freedom.

Physicists refer to the three values of the colour charge as blue, green and red. (This is more idiocy – you might as well call them ‘baboon’, ‘lion’ and ‘giraffe’.) If a blue quark, a green quark and a red quark come together to form a hadron (a class of particles that includes protons and neutrons), then the hadron will have a colour charge of ‘white’, becoming colour-neutral. Anti-quarks have anti-colour charges: antiblue, antigreen, antired. When a red quark and an antired anti-quark meet, they will annihilate each other – but not so when a red quark and an antiblue anti-quark meet.

Gluons complicate this picture further because, in experiments, physicists have found that gluons behave as if they have both colour and anti-colour. In physical terms, this doesn’t make much sense, but they do in mathematical terms (which we won’t get into). Let’s say a proton is made of one red quark, one blue quark and one green quark. The quarks are held together by gluons, which also have a colour charge. So when two quarks exchange a gluon, the colours of the quarks change. If a blue quark emits a blue-antigreen gluon, the quark turns green whereas the quark that receives the gluon will turn blue. Ultimately, if the proton is ‘white’ overall, then the three quarks inside are responsible for maintaining that whiteness. This is the law of conservation of colour charge.

Gluons emit gluons because of their colour charges. When quarks exchange gluons, the quarks’ colour charges also change. In effect, the gluons are responsible for quarks getting their colours. And because the gluons participate in the evolution of the force that they also mediate, they’re just gonzo: they can interact with themselves to give rise to new particles.

A gluon can split up into two gluons or into a quark-antiquark pair. Say a quark and an antiquark are joined together. If you try to pull them apart by supplying some energy, the gluon between them will ‘swallow’ that energy and split up into one antiquark and one quark, giving rise to two quark-antiquark pairs (and also preserving colour-confinement). If you supply even more energy, more quark-antiquark pairs will be generated.

For these reasons, the strong nuclear force is called a ‘colour force’: it manifests in the movement of colour charge between quarks.

In an atomic nucleus, say there is one proton and one neutron. Each particle is made up of three quarks. The quarks in the proton and the quarks in the neutron interact with each other because they are close enough to be colour-confined: the proton-quarks’ gluons and the neutron-quarks’ gluons interact with each other. So the nucleus is effectively one ball of quarks and gluons. However, one nucleus doesn’t interact with that of a nearby atom in the same way because they’re too far apart for gluons to be exchanged.

Clearly, this is quite complicated – not just for you and me but also for scientists, and for supercomputers that perform these calculations for large experiments in which billions of protons are smashed into each other to see how the particles interact. Imagine: there are six types, or ‘flavours’, of quarks, each carrying one of three colour charges. Then there is the one gluon that can carry one of nine combinations of colour-anticolour charges.

The Wire
September 20, 2017

Featured image credit: Alexas_Fotos/pixabay.

The secrets of how planets form

Astronomers who were measuring the length of one day on an exoplanet for the first time were in for a surprise: it was shorter than any planet’s in the Solar System. Beta Pictoris b, orbiting the star Beta Pictoris, has a sunrise every eight hours. On Jupiter, there’s one once every 10 hours; on Earth, every 24 hours.

This exoplanet is located 63.4 light-years from the Solar System. It is a gas giant, a planet made mostly of gases of light elements like hydrogen and helium, and more than 10 times heavier than Earth. In fact, Beta Pictoris b is about eight times as heavy as Jupiter. It was first discovered by the Very Large Telescope and the European Southern Observatory in 2003. Six years and more observations later, it was confirmed that it was orbiting the star Beta Pictoris instead of the star just happening to be there.

On April 30, a team of scientists from The Netherlands published a paper in Nature saying Beta Pictoris b was rotating at a rate faster than any planet in the Solar System does. At the equator, its equatorial rotation velocity is 25 km/s. Jupiter’s equatorial rotation velocity is almost only half of that, 13.3 km/s.

The scientists used the Doppler effect to measure this value. “When a planet rotates, part of the planet surface is coming towards us, and a part is moving away from us. This means that due to the Doppler effect, part of the spectrum is a little bit blueshifted, and part of it a little redshifted,” said Ignas Snellen, the lead author on the Nature paper and an astronomy professor at the University of Leiden.

So a very high-precision color spectrum of the planet will reveal the blue- and redshifting as a broadening of the spectral lines: instead of seeing thin lines, the scientists will have seen something like a smear. The extent of smearing will correspond to the rate at which the planet is rotating.


Bigger is faster

So much is news. What is more interesting is what the Leiden team’s detailed analysis tells us, or doesn’t, about planet formation. For starters, check out the chart below.

Spin_rate_chart
Image: Macclesfield Astronomical Society

This chart shows us the relationship between a planet’s mass (X-axis) and its spin angular momentum (Y-axis), the momentum with which it spins on an axis. Clearly, the heavier a planet is, the faster it spins. Pluto and Charon, its moon, are the lightest of the lot and their spin rate is therefore the lowest. Jupiter, the heaviest planet in the Solar System, is the heaviest and its spin rate is also the highest. (Why are Mercury and Venus not on the line, and why have Pluto and Earth been clubbed with their moons? I’ll come to that later.)

Apparently the more massive the planet, the more angular momentum it acquires,” Prof. Snellen said. This would put Beta Pictoris b farther along the line, possibly slightly beyond the boundaries of this chart – as this screenshot from the Leiden team’s pre-print paper shows.

planet_spin_rate1

Unfortunately, science doesn’t yet know why heavier planets spin faster, although there are some possible explanations. A planet forms from grains of dust floating around a star into a large, discernible mass (with many steps in between). This mass is rotating in order to conserve angular momentum. As it accrues more matter over time, it has to conserve the kinetic and potential energy of that matter as well, so its angular momentum increases.

There have been a few exceptions to this definition. Mercury and Venus, the planets closest to the Sun, will have been affected by the star’s gravitational pull and experienced a kind of dragging force on their rotation. This is why their spin-mass correlations don’t sit on the line plotted in the chart above.

However, this hypothesis hasn’t been verified yet. There is no fixed formula which, when plotted, would result in that line. This is why the plots shown above are considered empirical – experimental in nature. As astronomers measure the spin rates of more planets, heavy and light, they will be able to add more points on either side of the line and see how its shape changes.

At the same time, Beta Pictoris b is a young planet – about 20 million years old. Prof. Snellen used this bit of information to explain why it doesn’t sit so precisely on the line:

planet_spin_rate2

Sitting precisely on the line would be an equatorial velocity of around 50 km/s. But because of its youth, Prof. Snellen explained, this exoplanet is still giving off a lot of heat (“this is why we can observe it”) and cooling down. In the next hundreds of millions of years, it will become the size of Jupiter. If it conserves its angular momentum during this process, it will go about its life pirouetting at 50 km/s. This would mean a sunrise every 3 hours.

I think we can stop complaining about our days being too long.


Spin velocity v. Escape velocity

Should the empirical relationship hold true, it will mean that the heaviest planets – or the lightest stars – will be spinning at incredible rates. In fact, the correlation isn’t even linear: even the line in the first chart is straight, the axes are both logarithmic. It is a log-log plot where, like shown in the chart below, even though the lines are straight, equal lengths of the axis demarcate exponentially increasing values.

log-log
Image: Wikipedia

If the axes were not logarithmic, the line f(x) = x3 (red line) between 0.1 and 1 would look like this:

plot3
Image: Fooplot.com

The equation of a line in a log-log plot is called a monomial, and goes like this: y = axk. In other words, y varies non-linearly with x, i.e. a planet’s spin-rate varies non-linearly with its mass. Say, if k = 5 and a (a scaling constant) = 1, then if x increases from 2 to 4, y will increase from 32 to 1,024!

Of course, a common, and often joked-about, assumption among physicists has been made: that the planet is a spherical object. In reality, the planet may not be perfectly spherical (have you known a perfectly spherical ball of gas?), but that’s okay. What’s important is that the monomial equation can be applied to a rotating planet.

Would this mean there might be planets out there rotating at hundreds of kilometres per second? Yes, if all that we’ve discussed until now holds.

… but no, if you discuss some more. Watch this video, then read the two points below it.

  1. The motorcyclists are driving their bikes around an apparent centre. What keeps them from falling down to the bottom of the sphere is the centrifugal force, a rotating force that, the faster they go, pushes them harder against the sphere’s surface. In general, any rotating body experiences this force: something in the body’s inside will be fleeing its centre of rotation and toward the surface. And such a rotating body can be a planet, too.
  2. Any planet – big or small – exerts some gravitational pull. If you jumped on Earth’s surface, you don’t shoot off into orbit. You return to land because Earth’s gravitational pull doesn’t let you go that easy. To escape once and for all, like rockets sometimes do, you need to jump up on the surface at a speed equal to the planet’s escape velocity. On Earth, that speed is 11.2 km/s. Anything moving up from Earth’s surface at this speed is destined for orbit.

Points 1 and 2 together, you realize that if a planet’s equatorial velocity is greater than its escape velocity, it’s going to break apart. This inequality puts a ceiling on how fast a planet can spin. But then, does it also place a ceiling on how big a planet can be? Prof. Snellen to the rescue:

Yes, and this is probably bringing us to the origin of this spin-mass relation. Planets cannot spin much faster than this relation predicts, otherwise they would spin faster than the escape velocity, and that would indeed break the planet apart. Apparently a proto-planet accretes near the maximum amount of gas such that it obtains a near-maximum spin-rate. If it accretes more, the growth in mass becomes very inefficient.

(Emphasis mine.)


Acting forces

The answer will also depend on the forces acting on the planet’s interior. To illustrate, consider the neutron star. These are the collapsed cores of stars that were once massive but are now dead. They are almost completely composed of neutrons (yes, the subatomic particles), are usually 10 km wide, and weigh 1.5-4 times the mass of our Sun. That implies an extremely high density – 1,000 litres of water will weigh 1 million trillion kg, while on Earth it weighs 1,000 kg.

Neutron stars spin extremely fast, more than 600 times per second. If we assume the diameter is 10 km, the circumference would be 10π = ~31 km. To get the equatorial velocity,

Vspin = circumference × frequency = 31 × 600/1 km/s = 18,600 km/s.

Is its escape velocity higher? Let’s find out.

Ve = (2GM/r)0.5

G = 6.67×10⁻¹¹ m3 kg-1 s-2

M = density × volume = 1018 × (4/3 × π × 125) = 5.2×10²⁰ kg

r = 5 km

∴ Ve = (2 × 6.67×10-11 × 5.2×1020/5)0.5 =  ~37,400 km/s

So, if you wanted to launch a rocket from the surface of a neutron star and wanted it to escape the body’s gravitational pull, it has to take off at more than 30 times the speed of sound. However, you wouldn’t get this far. Water’s density should have given it away: any object would be crushed and ground up under the influence of the neutron star’s phenomenal gravity. Moreover, at the surface of a neutron star, the strong nuclear force is also at play, the force that keeps neutrons from disintegrating into smaller particles. This force is 1032 times stronger than gravity, and the equation for escape velocity does not account for it.

However, neutron stars are a unique class of objects – somewhere between a white dwarf and a black hole. Even their formation has nothing in common with a planet’s. On a ‘conventional’ planet, the dominant force will be the gravitational force. As a result, there could be a limit on how big planets can get before we’re talking about some other kinds of bodies.

This is actually the case in the screenshot from the Leiden team’s pre-print paper, which I’ll paste here once again.

planet_spin_rate1

See those circles toward the top-right corner? They represent brown dwarfs, which are gas giants that weigh 13-75 times as much as Jupiter. They are considered too light to sustain the fusion of hydrogen into helium, casting them into a limbo between stars and planets. As Prof. Snellen calls them, they are “failed stars”. In the chart, they occupy a smattering of space beyond Beta Pictoris b. Because of their size, the connection between them and other planets will be interesting, since they may have formed in a different way.

Disruption during formation is actually why Pluto-Charon and Earth-Moon were clubbed in the first chart as well. Some theories of the Moon’s formation suggest that a large body crashed into Earth while it was forming, knocking off chunks of rock that condensed into our satellite. For Pluto and Charon, the Kuiper Belt might’ve been involved. So these influences would have altered the planets’ spin dynamics, but for as long as we don’t know how these moons formed, we can’t be sure how or how much.

The answers to all these questions, then, is to keep extending the line. At the moment, the only planets for which the spin-rate can be measured are very massive gas giants. If this mass-spin relation is really universal, than one would expect them all to have high spin-rates. “That is something to investigate now, to see whether Beta Pictoris b is the first of a general trend or whether it is an outlier.”


Reference:

Fast spin of the young extrasolar planet β Pictoris b. Nature. doi:10.1038/nature13253